ANALYTICS FOR WEB TRAFFIC DATA PROFESSIONALS
Combine Nucleus and Google Analytics to get insight into your website’s traffic.
PULL DATA FROM GOOGLE ANALYTICS TO TRACK ACTIVITY IN YOUR ASSOCIATION’S WEBSITE.
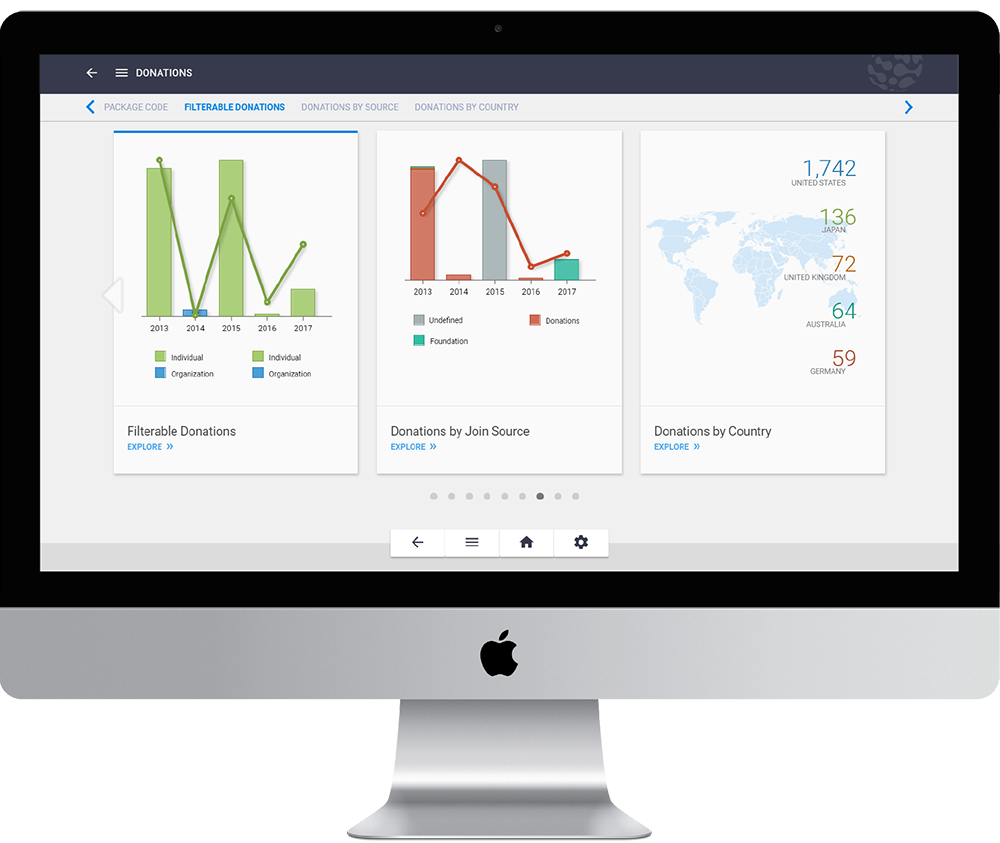
Visualize your Web Traffic data seamlessly with Nucleus.
Easily create stunning visualizations of all the data for your web traffic pulled by Google Analytics with Nucleus. Track multiple separate website assets to discern what is encouraging engagement and where improvements to your website could be made. This package is particularly useful when layered with other data such as email marketing to track where the traffic is coming from and how to strengthen those channels.

WEB TRAFFIC VISUALIZATIONS INCLUDE:
Key Metrics Goals
Stay up-to-date on your goals and how close you are to meeting them.
Sessions Count
Track how many total visits your website gets.
Page Views Count
Track which web pages on your site are getting the most visitors
Device Types Count
Discover which devices your visitors are using most often.
Visitors Count
Track how many unique visitors are accessing your website.
Session Length
Track how long visitors are spending on your website.
Browsers Count
Track how often a visitor accessed the site with a different browser to determine if you should make it more compatible with one browser than the others.
Operating Systems Count
Track which operating systems your visitors are most using.
Additional cards and metrics may be defined by the client and Nucleus based on requirements gathered during implementation. The Nucleus baseline is continually evolving; we will continue to add additional metrics to the baseline.
Filters Include:
- Browser
- State
- Country
- Device
- New/Returning Visitor
- Operating System
*All of the visualizations listed can be segmented by the filter built in to this package as well as by relevant filters that may be available from other packages.