ANALYTICS FOR EVENT PROFESSIONALS
Track event metrics
in near real-time with Nucleus.
EVENT TRENDS AT YOUR FINGERTIPS
Identify registration trends, monitor event revenue, and track against your goals in near real-time with Nucleus.
Gone are the days of being asked for complex event reports that take hours or days to compile. With Nucleus, your entire organization can track event registration and revenue, see how event registration is trending against past years, conduct geographical analysis, and more, on-the-fly in Nucleus.
UNLOCK INSIGHTS WITH NUCLEUS
REGISTRATION & REVENUE VISUALIZATIONS INCLUDE:
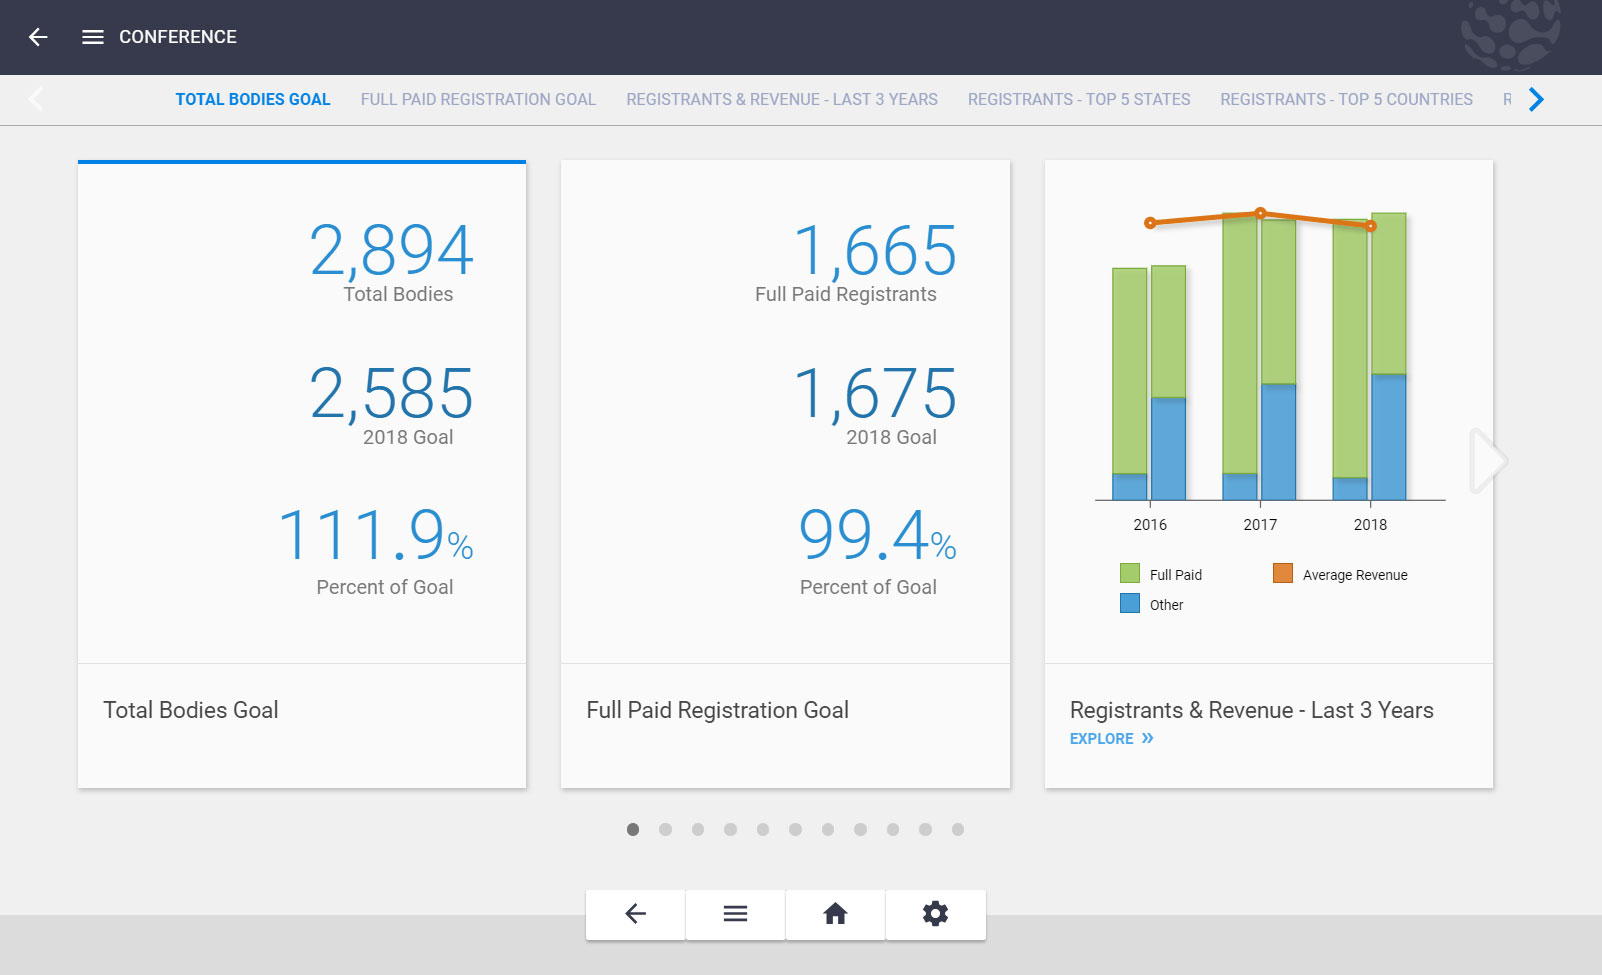
Event Registration Goal
Track your event registrations and how you’re tracking against your organizational goals in real time. The goal card includes a list with actual, target, and percentage complete for the current year.
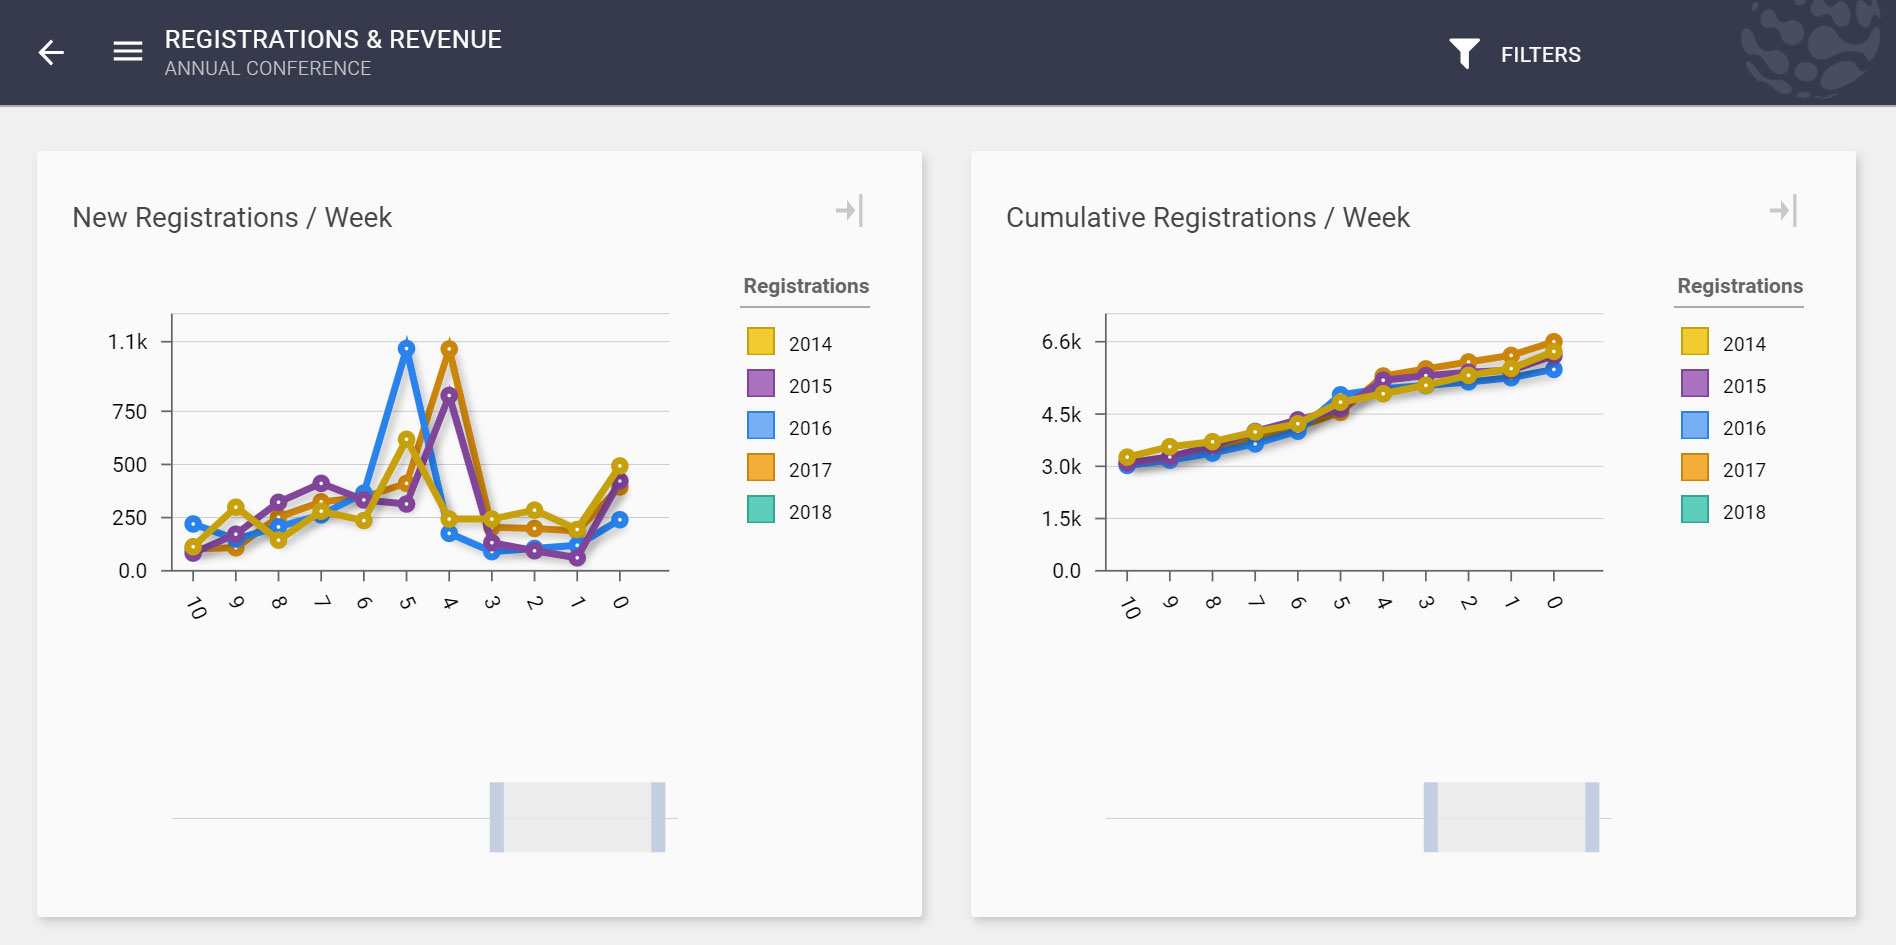
New Registrants by Week
Need pace charts tracking your performance in real time against your attendance goals? Now you can track new registrants with week-over-week pre-built reports at your fingertips.
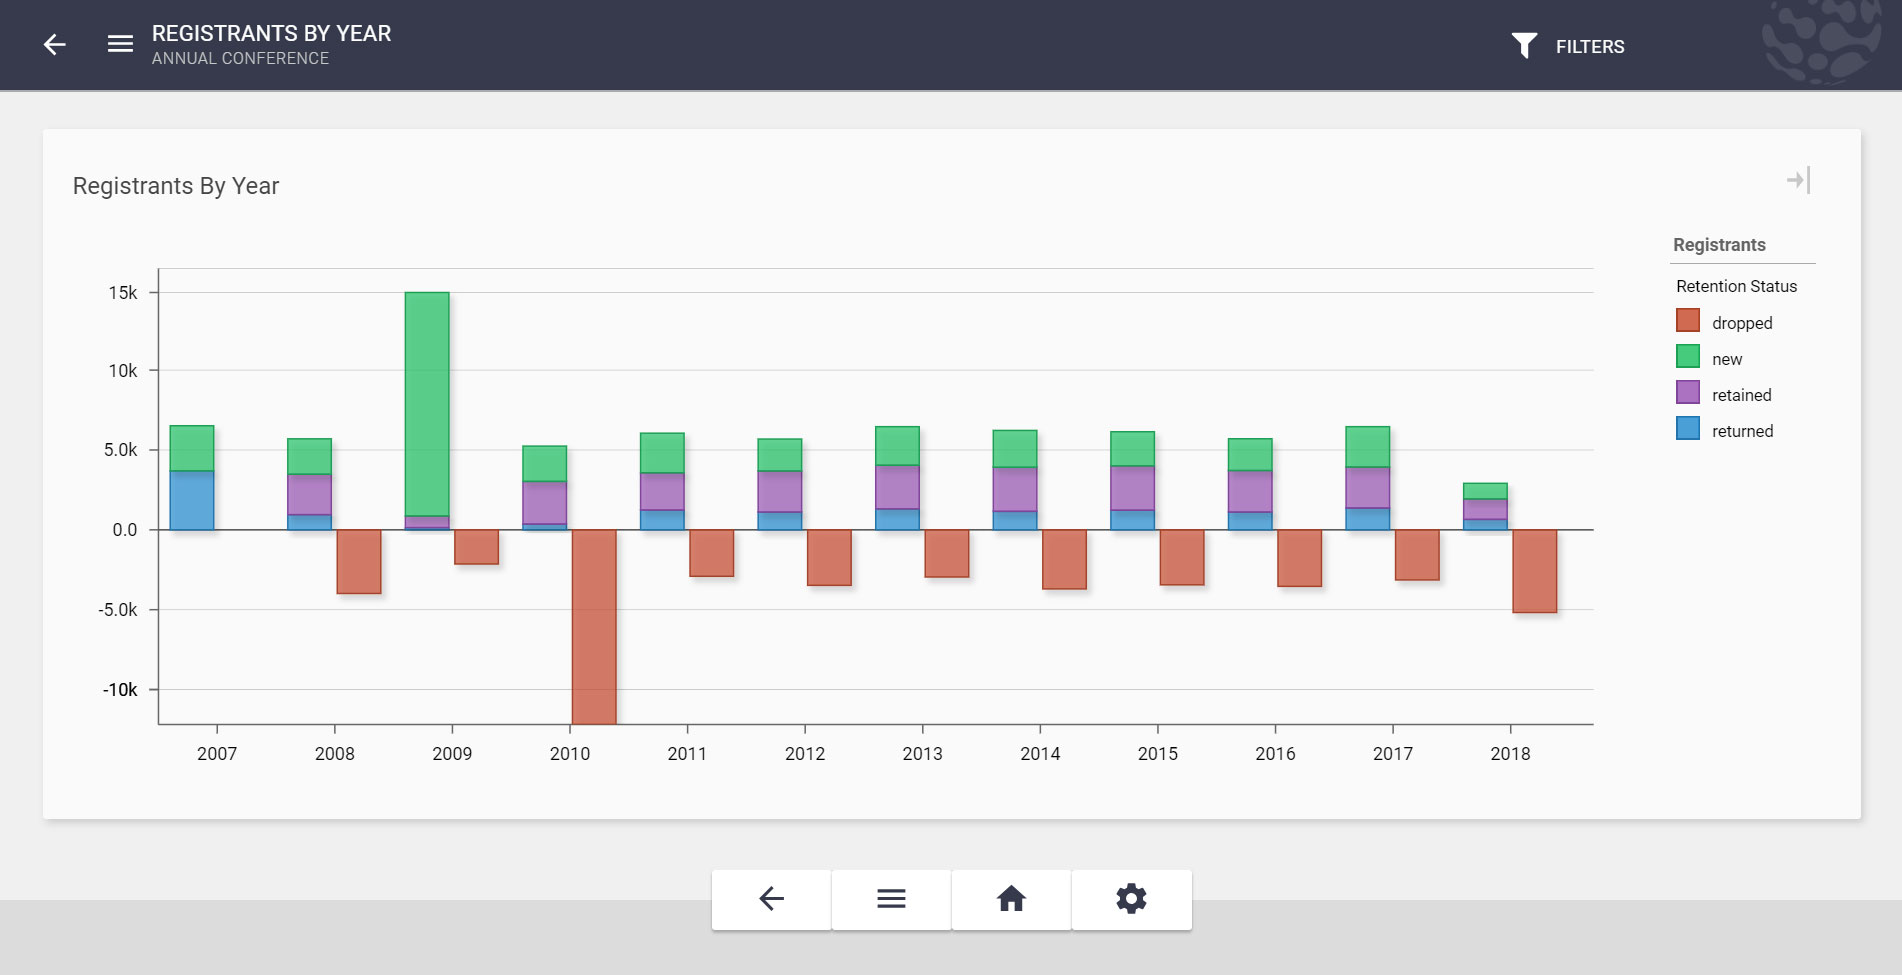
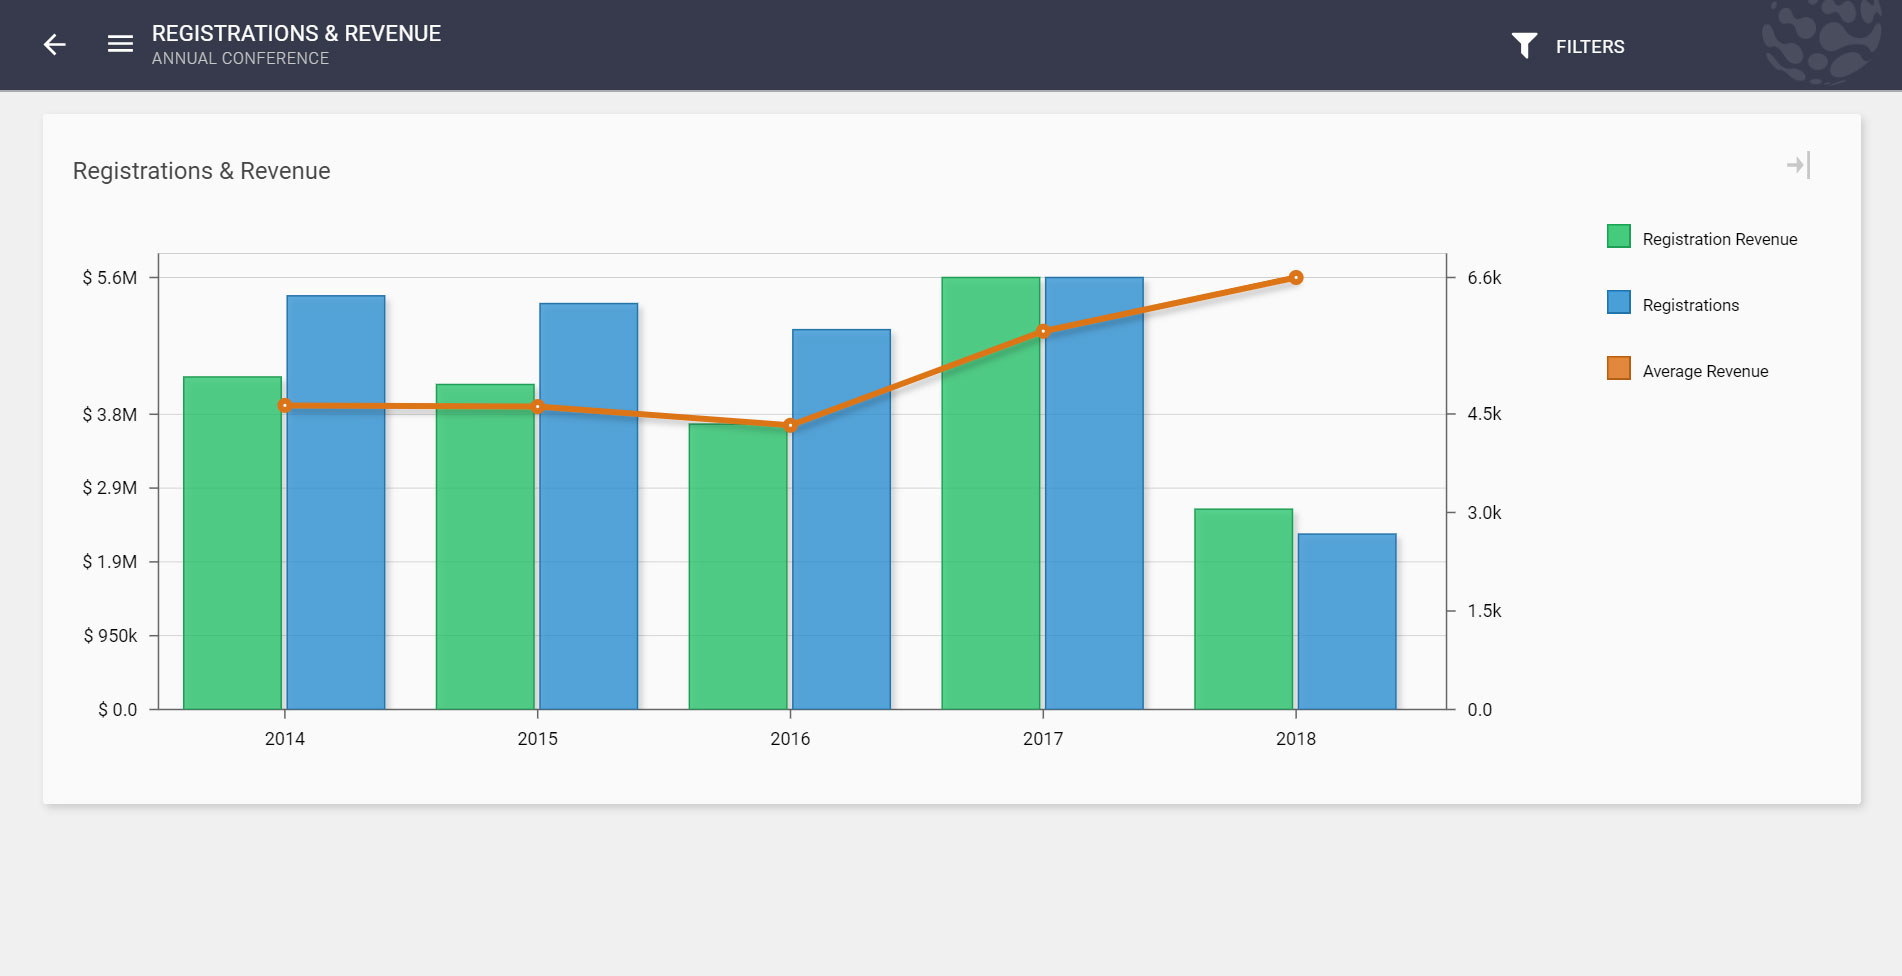
Registrations by Year
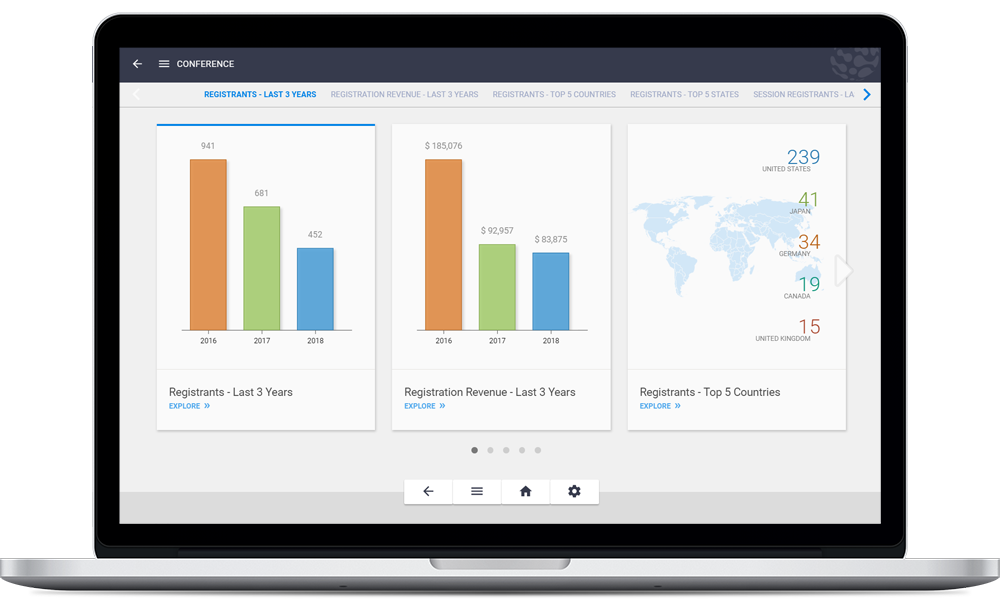
Tracking registrations by year has never been easier. Not only can you see who has registered, but who was new, who has returned, been retained, and dropped. This allows you to target dropped attendees with incentives to rejoin the event next year. The visualization includes the number of registrations, revenue, and average revenue over the last three years.
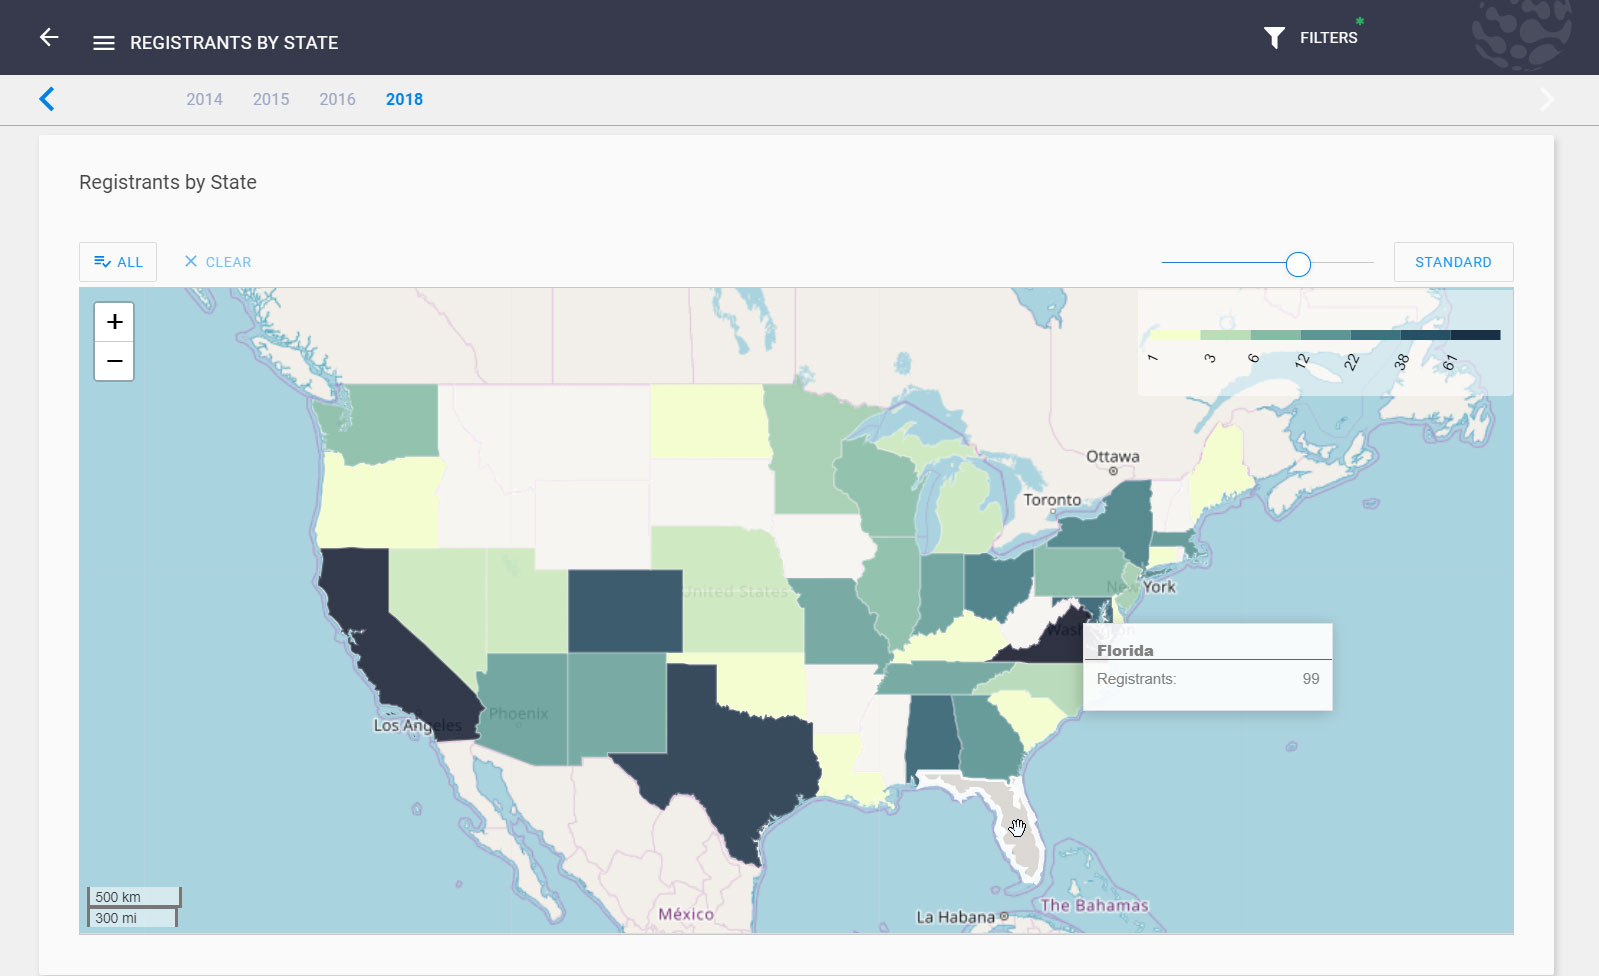
Registrants by Geography
Want to run geographical analysis on attendees in the area surrounding your event so you can easily target non-registered members with a promotion? You can choose between country, state, county, or congressional district. The visualization also includes a list of top 5 total amounts by geography.
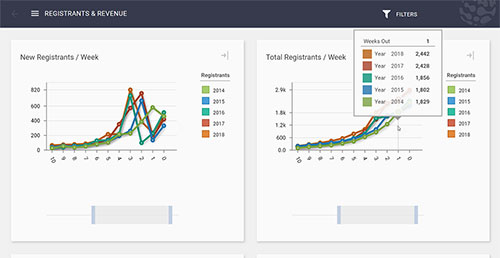
Year-to-Date Registrants by Week
Track your year-to-date registrations quickly and easily for faster reporting to your internal staff. Spot trends quickly and easily so you can pivot your strategy if your data shows a need to.
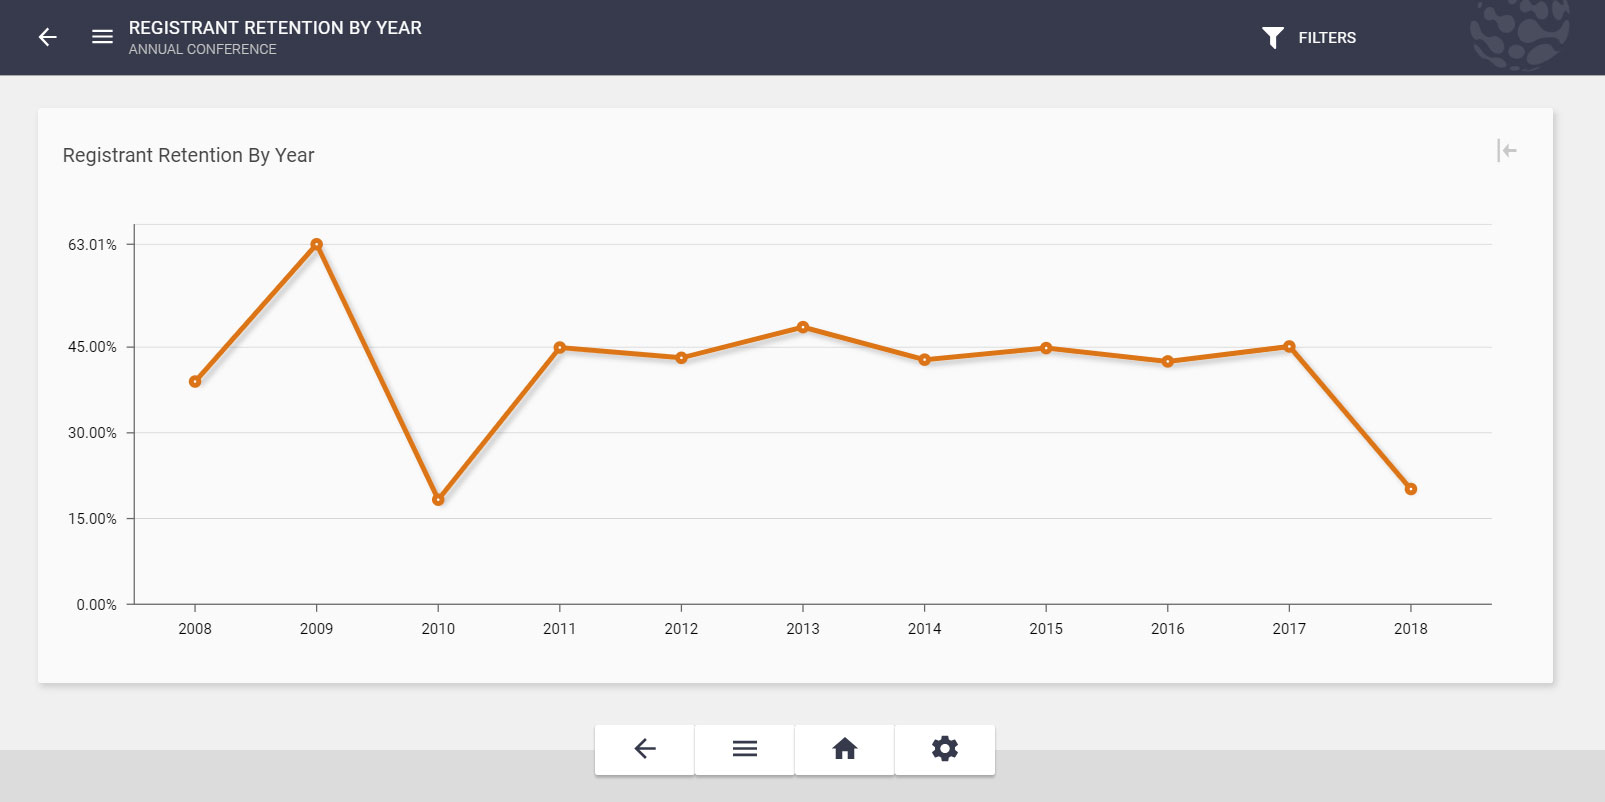
Registrant Retention
Monitor what percentage of your event registrants you’re retaining year over year without the need for complex calculations. Retention tracking includes year-over-year visualizations for the last five years.
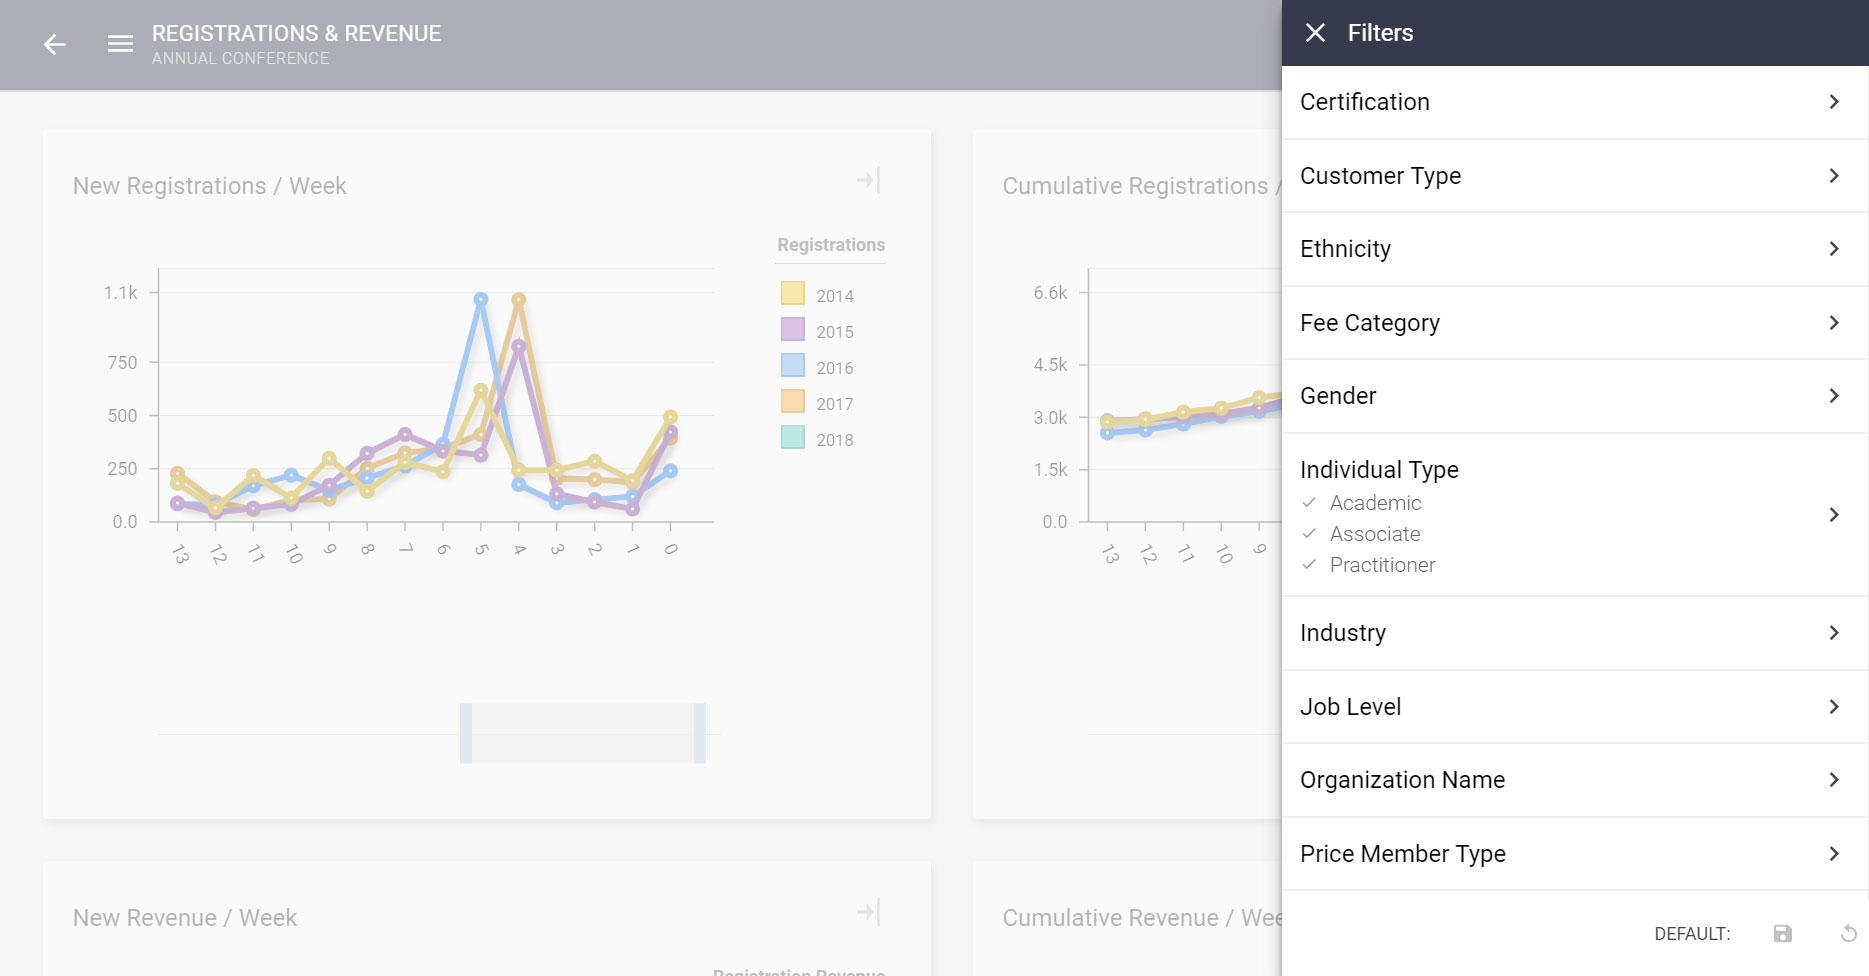
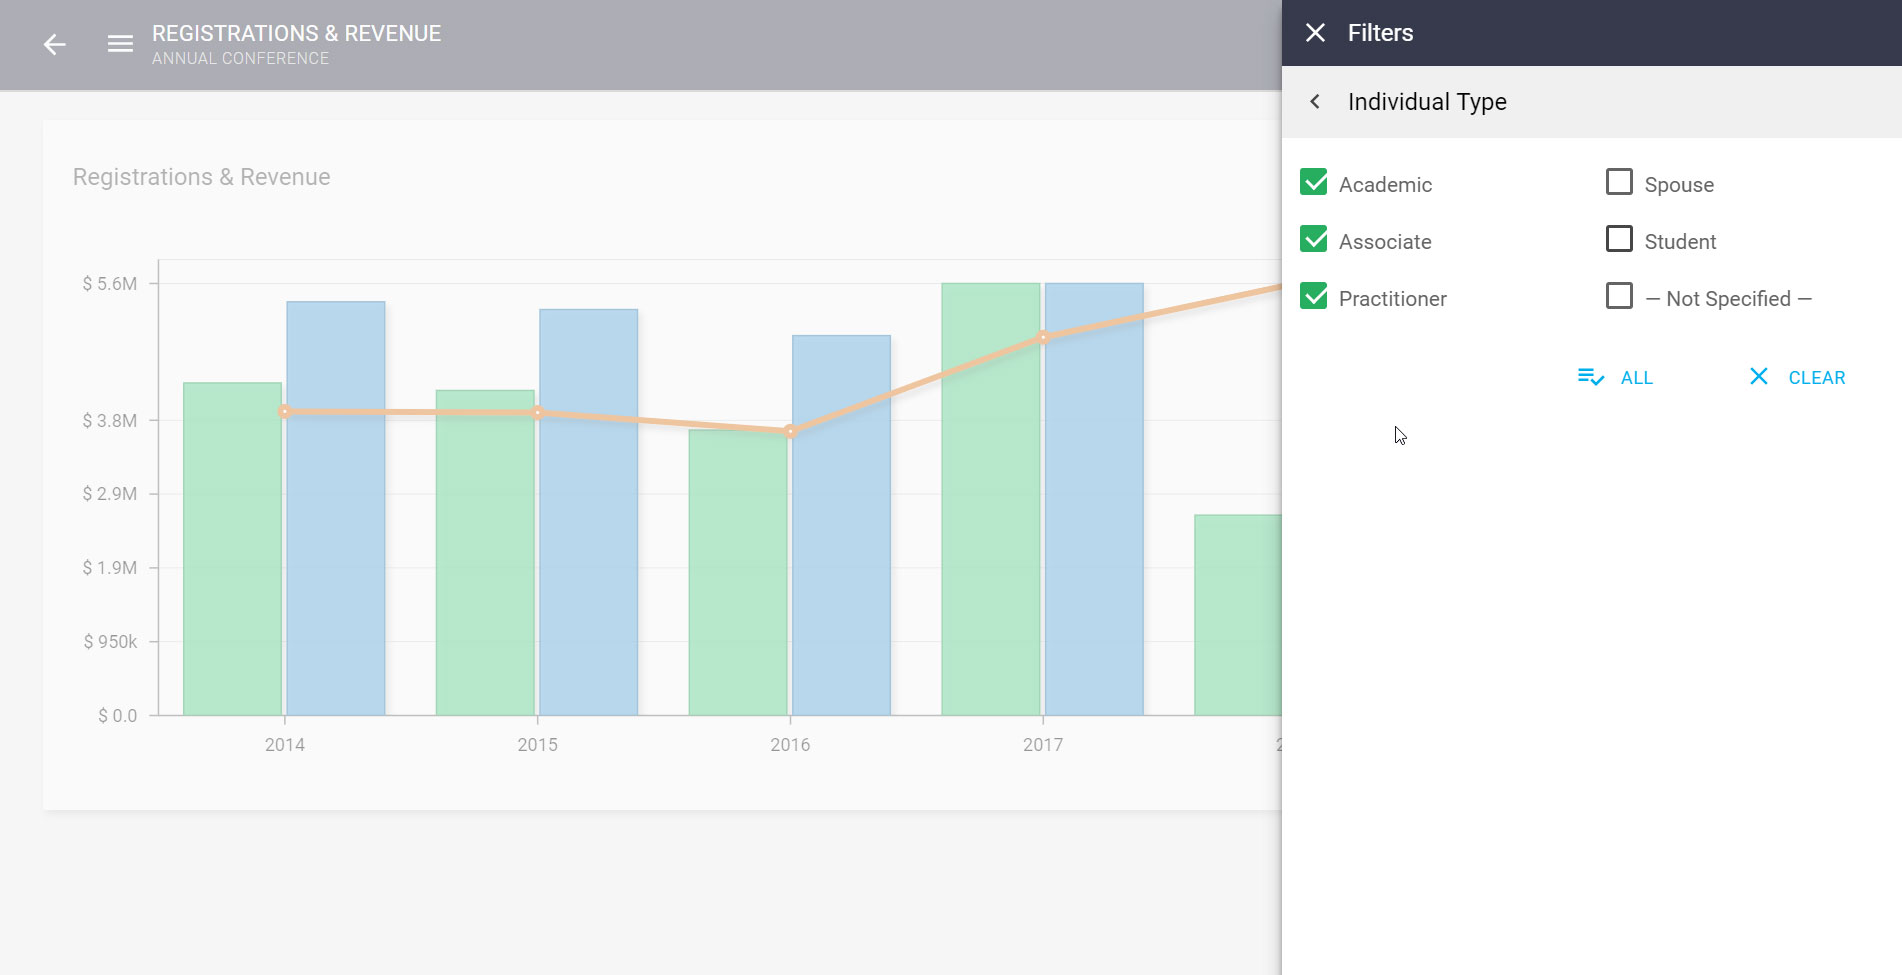
Filterable Registrations
Want to easily track how your event is performing by segment, so you can specifically target those lagging behind prior years’ registration? With our filterable list of registrations, revenue, and average revenue, you can track metrics over the last three years. The package includes up to five filters.
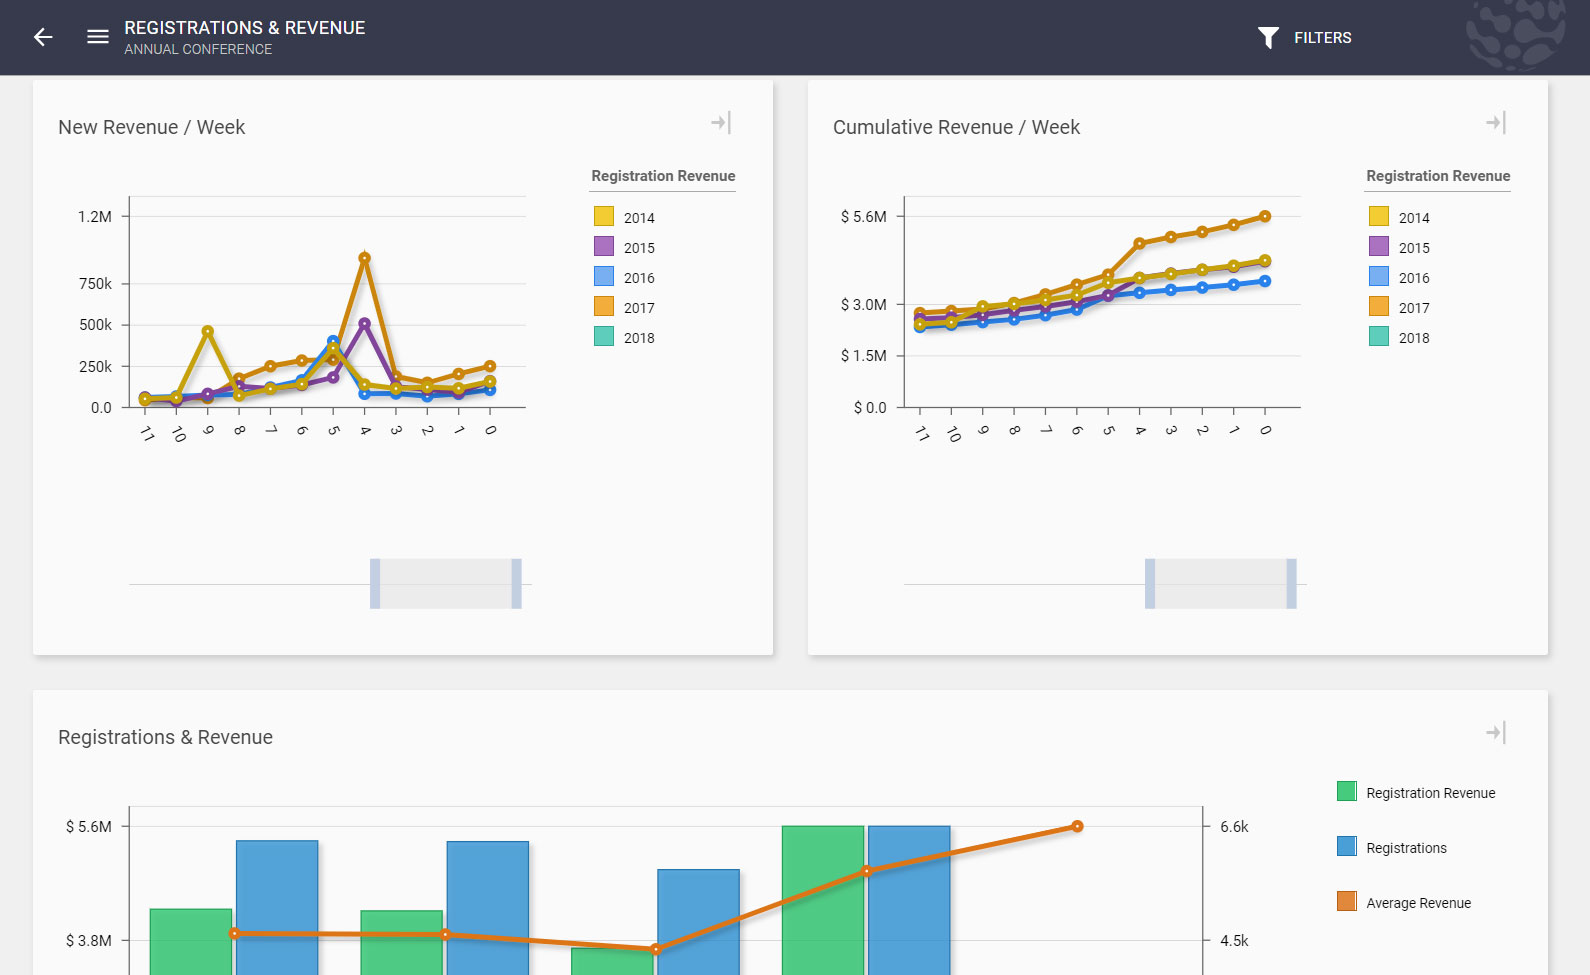
Filterable Revenue Reports
Track registration revenue, registrations, and average revenue per registrant seamlessly with the filterable revenue reports.
Year-to-Date Revenue by Week
Want to know how your registration revenue is trending against previous years, or this years goal? Now you can, with Nucleus. Easily track revenue year-to-date by month, grouped by year.
New Revenue by Week
Interested in seeing how your revenue is tracking week-over-week compared to previous years? With the new revenue by week report, you can easily track new revenue week-over-week grouped by year for quick and easy comparisons.
Filters Include:
- Fee category
- Registration type
- Payment type
- Cash
- Check
- Credit card
*All of the visualizations listed can be filtered by the filters built in to this package as well as by relevant filters that may be available from other packages.
- First-time vs. returning
- Retention status
- New
- Retained
- Returned
- Dropped
Event Registrants Baselines
Recurring
View key metrics for your recurring events so you can continue to improve these events, year after year.
Non-Recurring
Track key metrics for your non-recurring events, such as one-off meetings, webinars, or seminars, to keep abreast of the services your members are looking for.