ANALYTICS FOR SURVEYS
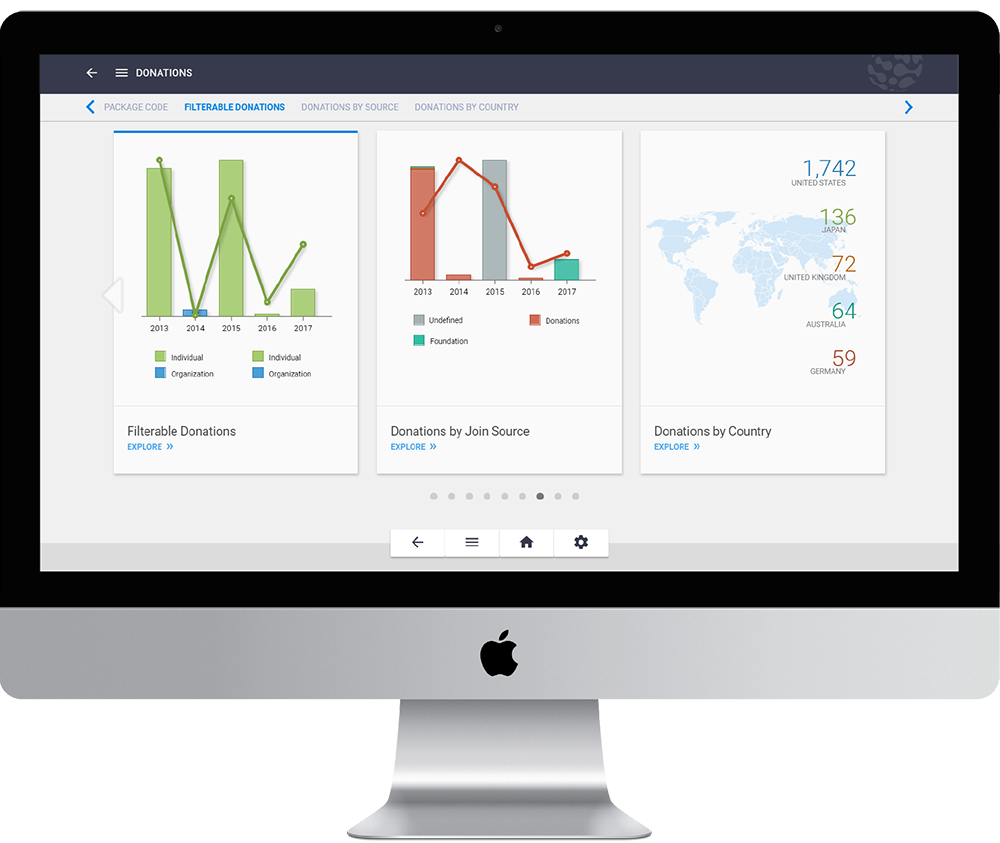
Easily create stunning visualizations using data aggregated from your survey tool.
VISUALIZE YOUR SURVEY DATA SEAMLESSLY WITH NUCLEUS.
Pull data from your survey tool to assess survey completion metrics and analyze responses.
Easily create stunning visualizations of all the data pulled from your survey tool to assess response metrics and compare with all the important segments from your membership database. Surveys are a fantastic way to get a direct response from your members about topics ranging from your members’ satisfaction rating to what they would like to see offered as either a service or product. Make that data easily available to all your staff and improve the value you provide your members.
USE SENTIMENT AND SEMANTIC ANALYSIS TO ANALYZE THE UNSTRUCTURED RESPONSES
Pull unstructured responses (text) from your surveys and convert into word maps that provide insight into your respondents thinking and feelings.
Go beyond the standard numerical responses provided in your surveys and aggregate and analyze the written responses provided by your members. Make these thoughtful responses part of the overall outcome from the survey.
SURVEY DATA VISUALIZATIONS INCLUDE:
Response Word Count
Track how long the responses are to determine how engaged with and how invested in the survey your members are.
Completion Time
Discover how much time your members are taking on each survey as a way to discern which topics matter the most to which members.
Completion Count
Find out the percentage of members who fully complete the survey and where the drop-offs begin to optimize future surveys.
Response Sentiment
Assess the sentiment behind your members’ responses by tracking the top 40 positive, negative, and neutral words they are using in their responses.
Frequently Used Words
Track which words your members use most and whether they are positive, negative, or neutral.
Sentiment by Word Count
Track which members are giving the longest responses and assess the sentiment behind that length to find out what they are most passionate about.
Additional cards and metrics may be defined by the client and Nucleus based on requirements gathered during implementation. The Nucleus baseline is continually evolving; we will continue to add additional metrics to the baseline.
Filters Include:
- Sentiment Category
- Gender
- Tenure
- Member Type
- Year
- Month
- Community
- State
*All of the visualizations listed can be segmented by the filter built in to this package as well as by relevant filters that may be available from other packages.