ANALYTICS FOR SALES PROFESSIONALS
Easily analyze data from your sales and orders.
PULL DATA ABOUT YOUR PRODUCTS AND SERVICES SALES TO DISCOVER WHICH ARE YOUR MOST POPULAR OFFERINGS
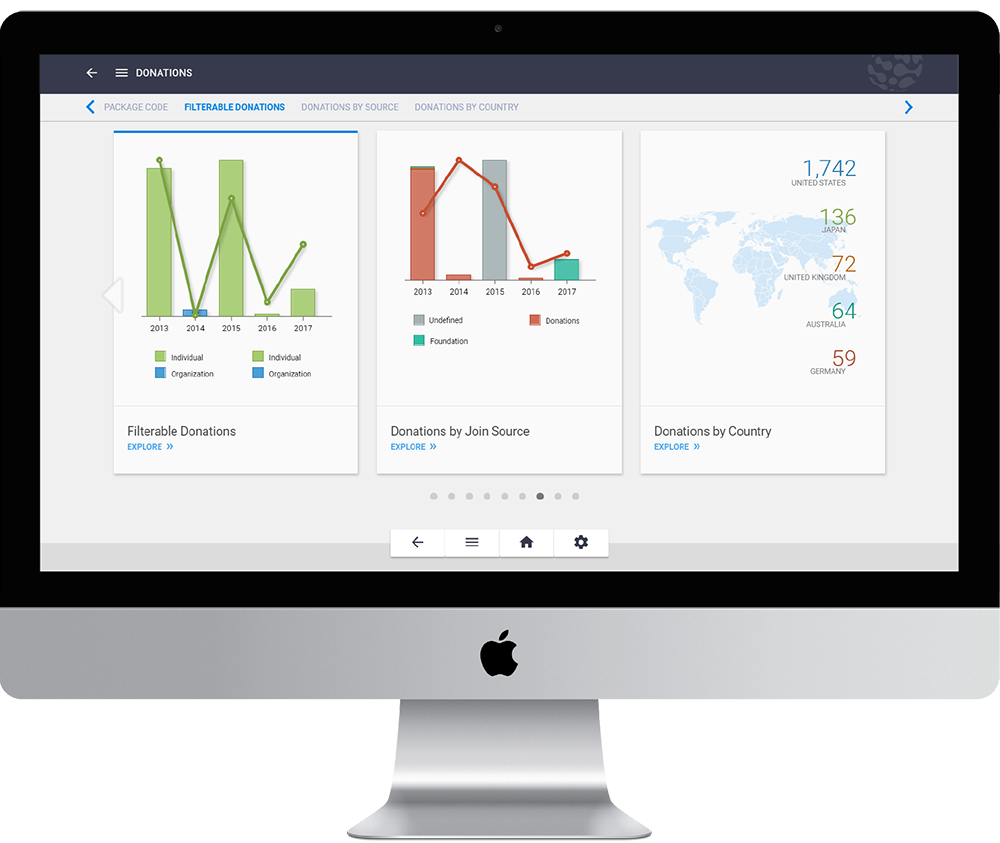
Visualize your sales and orders data seamlessly with Nucleus.
Easily create stunning visualizations of all your sales and orders data to discover new insights about your most popular products and services. View your members’ preferences and sales trends so you can confidently market your products and services to the most likely candidates. This package is intended to track any revenue generated outside of event registration and membership dues renewal.

SALES/ORDERS VISUALIZATIONS INCLUDE:
Purchases - last 3 years
Keep up to date with all your different purchases over the last 3 years.
Purchased Products by Type - Current Year
Track your purchases by product type to stay up-to-date on which products are selling and which aren’t.
Purchased Products by Sales Categories - Current Year
Discover what area of your organization your members are most interested in buying products for.
YOY Revenue by Month
Keep track of your year over year revenue by month.
Purchased Products - top 5 - Current Year
Keep track of your most popular products to understand the trends in your sales.
Purchases - Top 5 States
Track which products are most popular in which states and which states are making the most purchases.
Additional cards and metrics may be defined by the client and Nucleus based on requirements gathered during implementation. The Nucleus baseline is continually evolving; We will continue to add additional metrics to the baseline.
Filters Include:
- Gender
- Generation
- Product Category
- Sales Category
- State
- Member Status
- Member Type
- Primary Discipline
- Practice Setting
- Dues Category
*All of the visualizations listed can be segmented by the native filters in this package as well as by relevant filters that may be available from other packages.