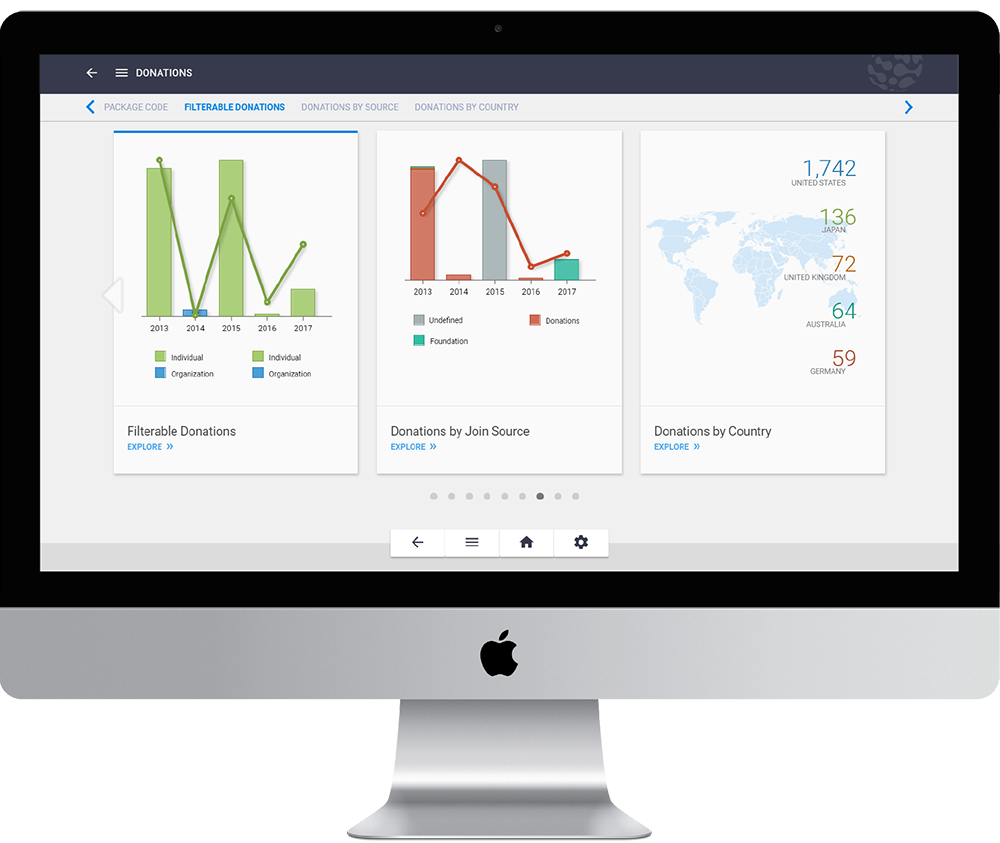
ANALYTICS FOR COMMITTEES
Easily visualize your committee data and participation metrics.
VISUALIZE YOUR COMMITTEE DATA SEAMLESSLY WITH NUCLEUS.
Pull activity data about your committee and your committee participant metrics to keep track of how the many facets of your organization are being run.
Easily create stunning visualizations of all the data aggregated about your different committees and committee participants. Keep track of how many committees you have in your organization and how many different types there are as well as how many people are in each committee and what their demographics are to ensure diversity and inclusion.

COMMITTEE VISUALIZATIONS INCLUDE:
Key Metrics Goals
Keep up to date with all your committee metrics to ensure you are reaching your goals.
Committee Participation
Track how many participants are in each committee and what their demographics are to make sure that there is a wide variety of view points.
Committee & Affiliation Tenure
Track the tenure of each participants on each committee and calculate the average tenure of the entire group.
Committee Count
Track how many committees your organization has and what the different types are to guarantee all you organization’s interests are getting the attention they need.
Committee Members by (primary filter A-C)
Track committee member metrics by primary filters that you set to ensure your committees reflect the diversity of your organization. Example filters could be gender, age, tenure, or race.
Additional cards and metrics may be defined by the client and Nucleus based on requirements gathered during implementation. The Nucleus baseline is continually evolving; We will continue to add additional metrics to the baseline.
Filters Include:
- Gender
- Tenure
- Member Type
- Committee Type
- State
- Country
*All of the visualizations listed can be segmented by the filter built in to this package as well as by relevant filters that may be available from other packages.