Data is one of the hottest topics in business today, and the way it impacts business function is only getting started. Organizations are scrambling to glean insights from what data they have, while preparing for the exponential growth that will impact every facet of operations. Knowing these five trends will keep you ahead of the curve in 2019:
- Data beyond visuals
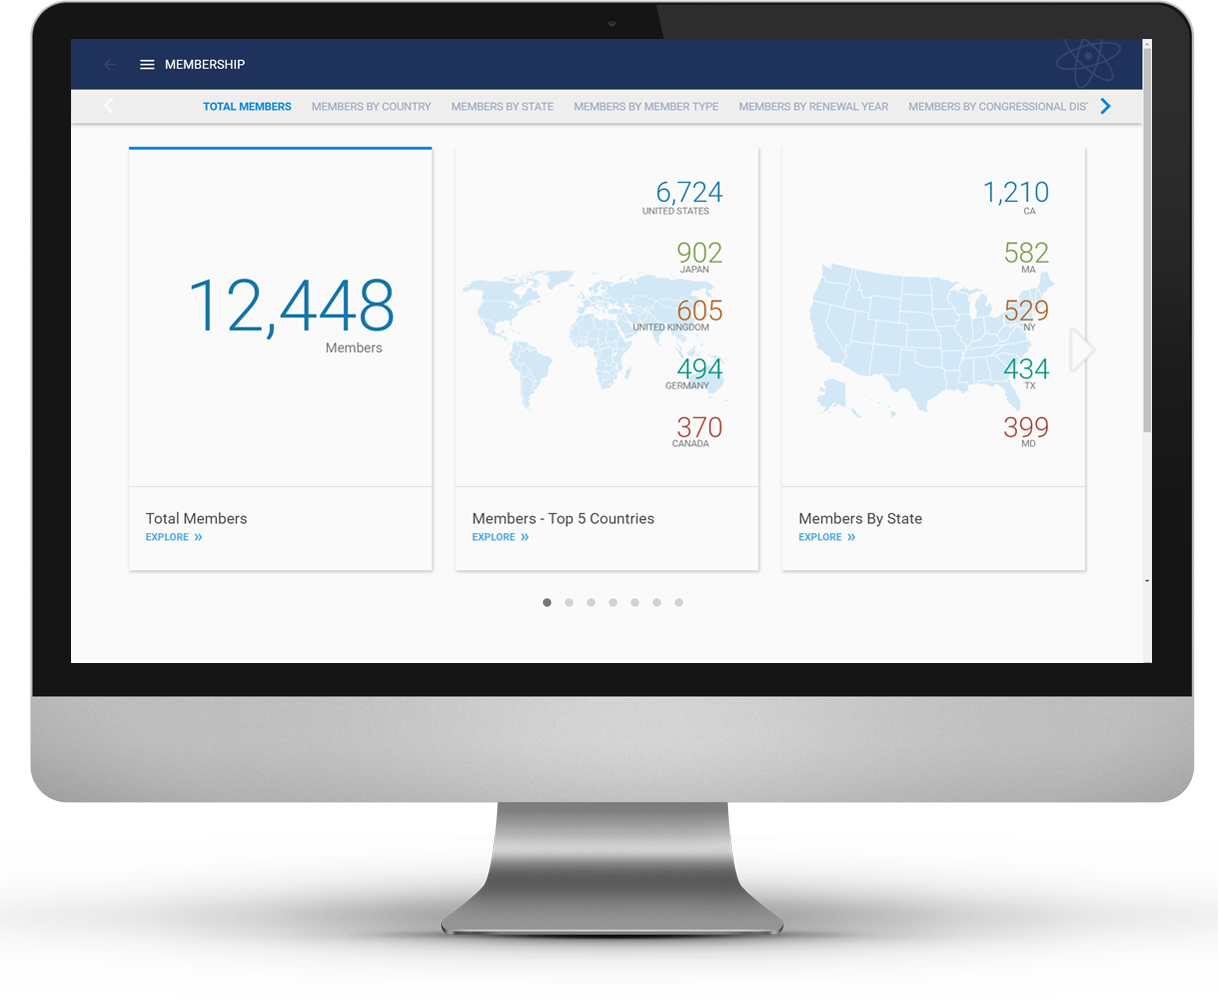
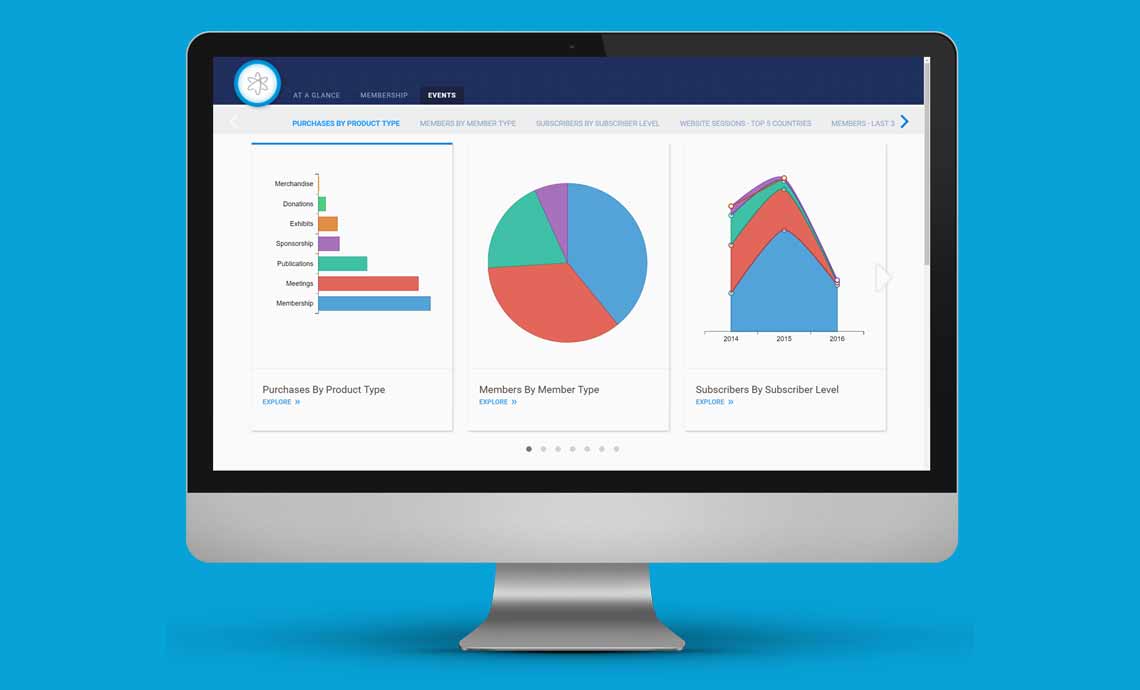
Visualizations are tremendously important, but they’re only the tip of the iceberg. Many people get stuck on the interface itself, and understandably, because that’s the most obvious component to any platform. But beyond the visuals, data must inform and empower teams to take meaningful action.2019 will bridge the remaining gap between the front-end visualizations and leave platform differentiation to how the technology works and its capabilities.
The truth is, beautiful doesn’t equate actionable. If data visuals aren’t accessible in real-time from anywhere on a mobile device, then who cares?! Or worse, if they are only capable of representing structured data, then they’ll exclude 80% of your organization’s data.
Not all data visualization platforms are created equally, so it’ll pay dividends in 2019 to investigate what’s really under the hood, what technologies it can connect to, the total cost of ownership, and how long it will take to get up and running.
- Data democratization
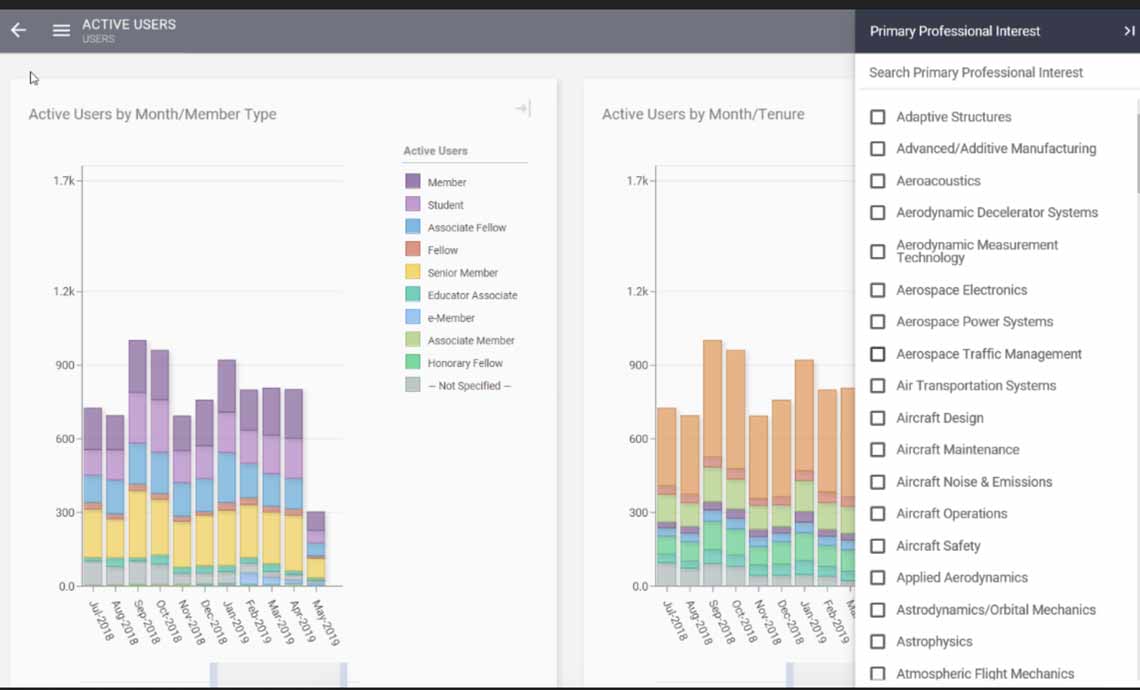
Organizations are trending away from one person or small team (typically IT) as responsible for accessing and creating reports.“The goal is to have anybody use data at any time to make decisions with no barriers to access or understanding.” – Bernard Marr, Forbes
In 2019, data matters to all job functions across the organization, and it will become increasingly important that everyone is able to access, use, and interpret data for everyday decision-making. Giving data access to all will increase the likelihood that teams optimize revenue-generating opportunities and create compelling, data-informed offerings for unique membership segments. Because not all tools support democratization, it will also become a differentiator among platforms.
- Data storytelling
Users will become more familiar with data visualization to the point of being able to create and tell stories that “deliver personalized, convenient, and magical experiences” for members. Informed decisions are made by human beings, and humans relate to stories more than data points. As organizations get better at understanding their data, they’ll tell impactful stories that delight their members. Embedding visualizations directly into applications and portals will become even more common as organizations focus on data storytelling.Our recommendation for 2019: sign up for a class, consider attending a conference, or sign up for our data boot camp to help you understand data better. It is a crucial skill that will aid you in literally every aspect of your career development.
- Data cleansing
Many organizations discovered new things about themselves via data in 2018. Among many insights, they also learned about holes or inaccuracies in their data. Missing pieces, mislabeled information, etc. Insights and discovery will continue in 2019, but more attention – and funding – will be given to data cleansing initiatives. And moving forward, organizations will employ some creative tactics to inform and incentivize members to complete missing data. - Data governance
Arm in arm with data cleansing, data governance is about creating new organizational processes to create a unified, streamlined approach to data. It is the answer to inconsistent management of data by different individuals or teams, and defines common terminology, rules for use, permissioning, security planning, and communication strategy for a unified approach.In 2019, data governance will become a larger focus than it’s ever been, with organizations spending time to create data governance plans and strategies. The most advanced associations will take this on sooner rather than later, and they’ll reap enormous benefits from having a plan in place as data volume continues to increase.
Make 2019 the year that you learn as much as you can about data. Study how it’s impacting your industry, your association, and especially your field of expertise. Develop questions, thoughts, and opinions about how to best use data for your role. The better you understand data, the more equipped you’ll be to overcome organizational challenges and increase membership satisfaction.