Back in July, we responded to the waves of client interactions we were having regarding the entirely new types of member data that were being generated by virtual events – things that can be known about attendees of virtual events but not live ones.
An example of this is being able to track which sessions each individual attendee attended, and for how long. Another is to know exactly how each attendee interacted with each of your sponsors and exhibitors. We explored these in a blot titled The New Member Data Produced by Virtual Events and created an infographic depicting 2020 virtual event benchmarks.
It’s the virtual event data relevant to your sponsors and exhibitors that we want to examine more closely here, and to do this we collaborated with longtime member industry consultant Scott Oser.
Scott had been working with the Society for Vascular Ultrasound on their last 3 Annual Conferences, and as part of preparing them for their first virtual one, he conducted a great deal of research into the latest digital event innovations to create a comprehensive list of possible exhibitor/sponsor benefits for their consideration.
There are so many options to consider and event organizers are working so hard to put together attractive offerings for exhibitor and sponsors, that we realized one aspect that can be difficult is having a solid overview of which of these benefit options appeal most to most vendors.
Scott and the Gravitate team worked together to consolidate his comprehensive list of options into “Sponsor & Exhibitor Benefit” categories.
We then looked at the type of data that each of these benefit types generates, with special focus on the degree to which each of these conveys direct trackable interest on the part of the attendee in the vendor’s company or product.
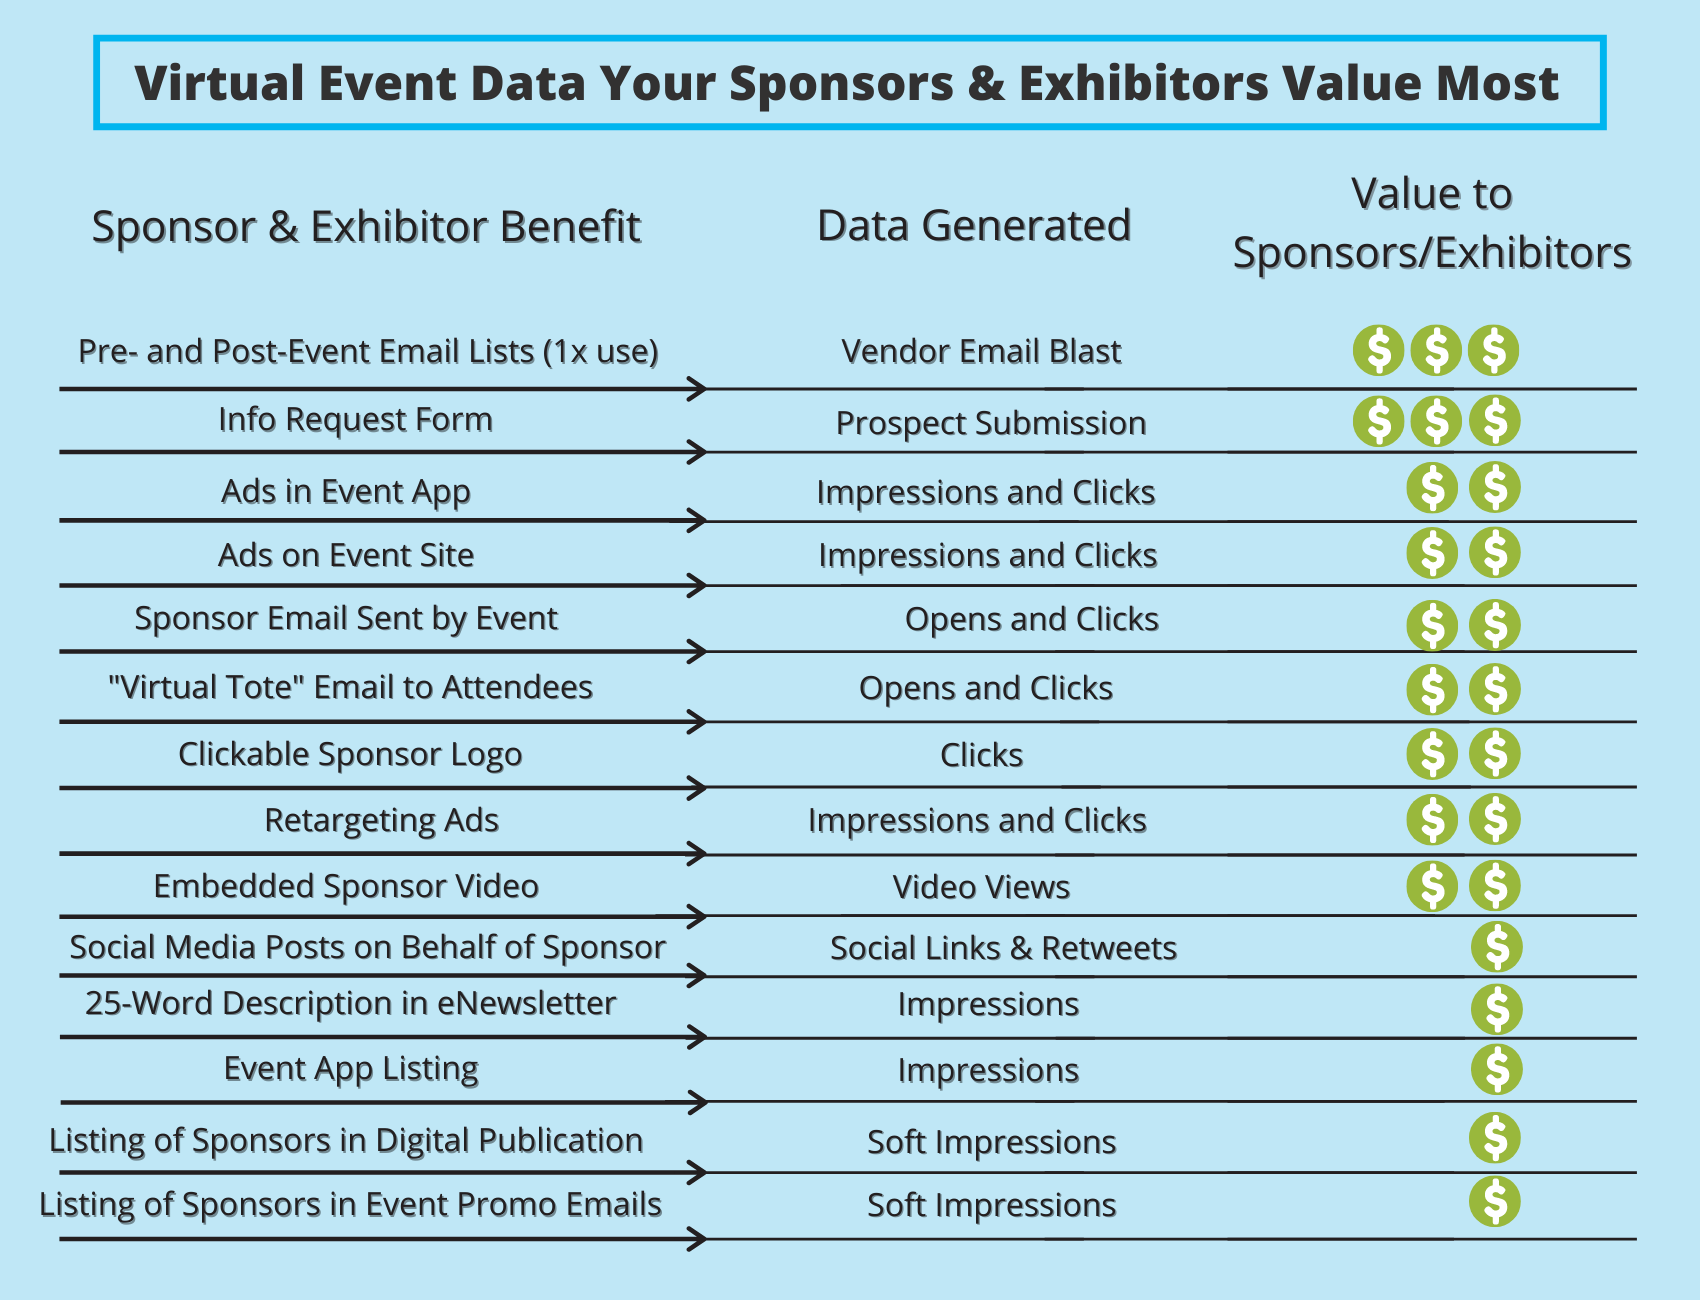
We then put together this infographic to help association professionals better understand not only the array of exhibitor/sponsor benefits available for their consideration, but also the value that each of these options hold to those potential sponsors/exhibitors.
The infographic below reads left to right – each Sponsor/Exhibitor Benefit, then the type of data it generates, and finally dollar signs representing how valuable most sponsors/exhibitors will find each one.

Parting thought
We hope that this infographic will help you to create appropriate benefit bundles for upcoming events (be they virtual, in-person or hybrid), price them appropriately, and get your sponsors and exhibitors excited! They will appreciate that you understand and are considering the value of each benefit in your offerings.
Contact information for Scott Oser:
Scott Oser, MBA
Scott Oser Associates
301-279-0468 (work)
240-305-5763 (cell)
600 9th Street
Coronado, CA 92118
http://scottoserassociates.com