Gravitate is thrilled to announce that we added a self-service visualization builder to the Nucleus Data Analytics platform. Self-Service is a game-changer for our clients as they can now add an unlimited number of charts and graphs to Nucleus without needing our help.
These enhancements are configurations to the system and thus are automatically protected and enhanced during an upgrade. Combined with our off-the-shelf carousels, configured for each department, our clients receive the best of both worlds – a comprehensive array of department specific association analytics and the flexibility to support future unknown needs.
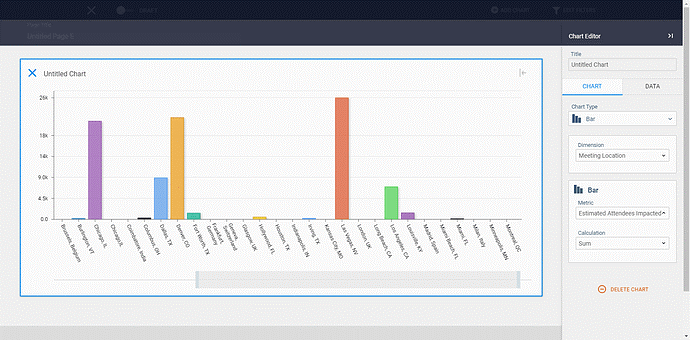
The new capability includes a guided interface (included visual) to support the creation of pages and charts. One-to-n number of charts can be added to a page so that purpose-specific dashboards can be created.
Any user can have access to build their own charts as long as they have been provided the appropriate security access. Once the page is ready to be shared, it’s published for all users to view and explore. Once published, all the same wonderful Nucleus features are provided to the end user with the self-service visualizations: filtering, print to PDF, drill to the data, and export.
My first meaningful opportunity to use the new self-service capability was to configure new pages and charts in the Nucleus COVID-19 Dashboard. This is a site that we have created for our clients and the association community to help them make business decision. While the Gravitate technology team assembled the initial visualizations in the dashboard, I identified some new data insights and configured some new pages and visualizations myself. Check-out my handiwork – no technical support needed. Ha!