If the deluge of data science buzzwords has your head spinning faster than a ruby-slipper-wearing Kansan on her way to Oz, you’re not alone. In this post, I’ll discuss the differences between data warehouses, business intelligence, analytics, and other terms that are showing up in our web feeds, conferences, and boardrooms. By the end of this yellow brick blog post, we’ll have the business intelligence brain, heart, and courage to pull back the curtain on… so sorry, I got carried away with my metaphor – now, let’s BI!
Why should you care?
These terms are interrelated enough that they are sometimes used ambiguously and interchangeably, but there are specific differences in each that, once understood, can help knock down the barriers of adopting data-driven strategies. In the spirit of data-driven strategies, let’s have a data-driven conversation.
The Google Trends chart below shows relative search interest in each of the concepts above over time in the United States. Declining search interest in data warehousing (blue) appears to be replaced by a growing interest in analytics (orange) whereas business intelligence (red) has been fairly consistent for the last 12+ years. The descriptions of each concept that follows will nicely explain these trends and help give you a starting point for discovering solutions to adopt that can improve your organization’s success.
Business intelligence
Business intelligence (BI) is the application of data, technology, analytics, and human expertise to provide insights that results in more successful business outcomes. Many, if not all, BI solutions begin with a need and a hypothesis. (Pro Tip: If you want BI because everyone is doing it, stop and find your need first.)
Having identified your need, “to improve declining renewal rates,” for example, you can make a hypothesis about that need– “it’s because Millennials don’t renew.” At this point you can combine data, technology, analytics, and/or human expertise to confirm or bust your hypothesis. In the example above you’re probably looking for correlations between renewal rate and age demographics. “Do Millennials renew at lower rates than our membership as a whole?” “Are they a large enough group to impact overall renewal rates?” If your hypothesis is busted, you search for other causes. Once you understand the cause of declining renewal rates, you can confidently implement corrective actions, then measure the impact of those actions.
The BI ecosystem provides many possible solutions and the landscape is changing every day. To resolve your need, you may need a data warehouse, you many need an analytics tool, you may need both, or you may need neither. It’s my belief that while BI processes and tools have changed over the years, the need for BI has remained consistent. The Google Trends chart above seems to confirm this.
If you’re not sure which solutions can help you test your hypotheses, you should begin by searching the internet for “business intelligence,” reading BI books, attending BI conferences, or requesting the help of BI service professionals such as Gravitate Solutions’ BI team.
Data warehouse
The bulk of your organization’s raw data likely lives in multiple operational systems, logs, and unstructured data sources. A data warehouse (DW) is a centralized location that brings all of that data together and optimizes it for reporting and analysis. Data warehousing is a very mature, well-defined, and structured application of BI.
Extract, transform, and load (ETL) processes are created that copy, clean, and load data from source systems into the data warehouse. A data warehouse implementation often focuses on business processes that generate data. That data is then turned into Key Performance Indicators (KPIs) and other valuable metrics. Once in the DW this data can be easily consumed by many other applications and tools all with consistent results.
The benefits of Data Warehouses are:
- Easier and more efficient query writing
- Reduced resource contention for operational systems
- Ability to easily query across data from multiple source systems
- Ability to easily query point-in-time snapshots of historical data
- Rigid data quality processes that ensure consistent, trustworthy data
The trade off of a Data Warehouse is that the benefits of performance, convenience, and consistency come at the cost of up-front effort of design and implementation. DWs are evolving databases. Since they are built around business processes, and BI’s goal is to improve them, DWs change with improving business processes thus require a continual investment.
Data Warehouses are undeniably essential to any medium-to-large-scale BI ecosystem, but can be cost- or time-prohibitive for an organization just beginning to dip their toe in the BI waters. Enabled by open source and in-memory technologies, Agile Business Analytics is emerging to bridge this gap. The agile approach flips the DW process by discovering insights first then investing in structured processes and databases later. The emergence of these tools and processes are why I believe the search trends interest in DWs had leveled off in recent years in favor of analytics.
Analytics
Analytics, often referred to as Business Analytics, combines data and theories into models, that when setup correctly, provide insights that enable improved business results. Analytics can be a process, tool, or application. There are three main flavors of analytics:
- Descriptive Analytics: uses reporting and visualizations to describe what happened based on historical data
- Predictive Analytics: uses statistics and machine learning algorithms to anticipate future outcomes
- Prescriptive Analytics: uses simulation and optimization, sometimes of predictive models, to automatically recommend or perform actions
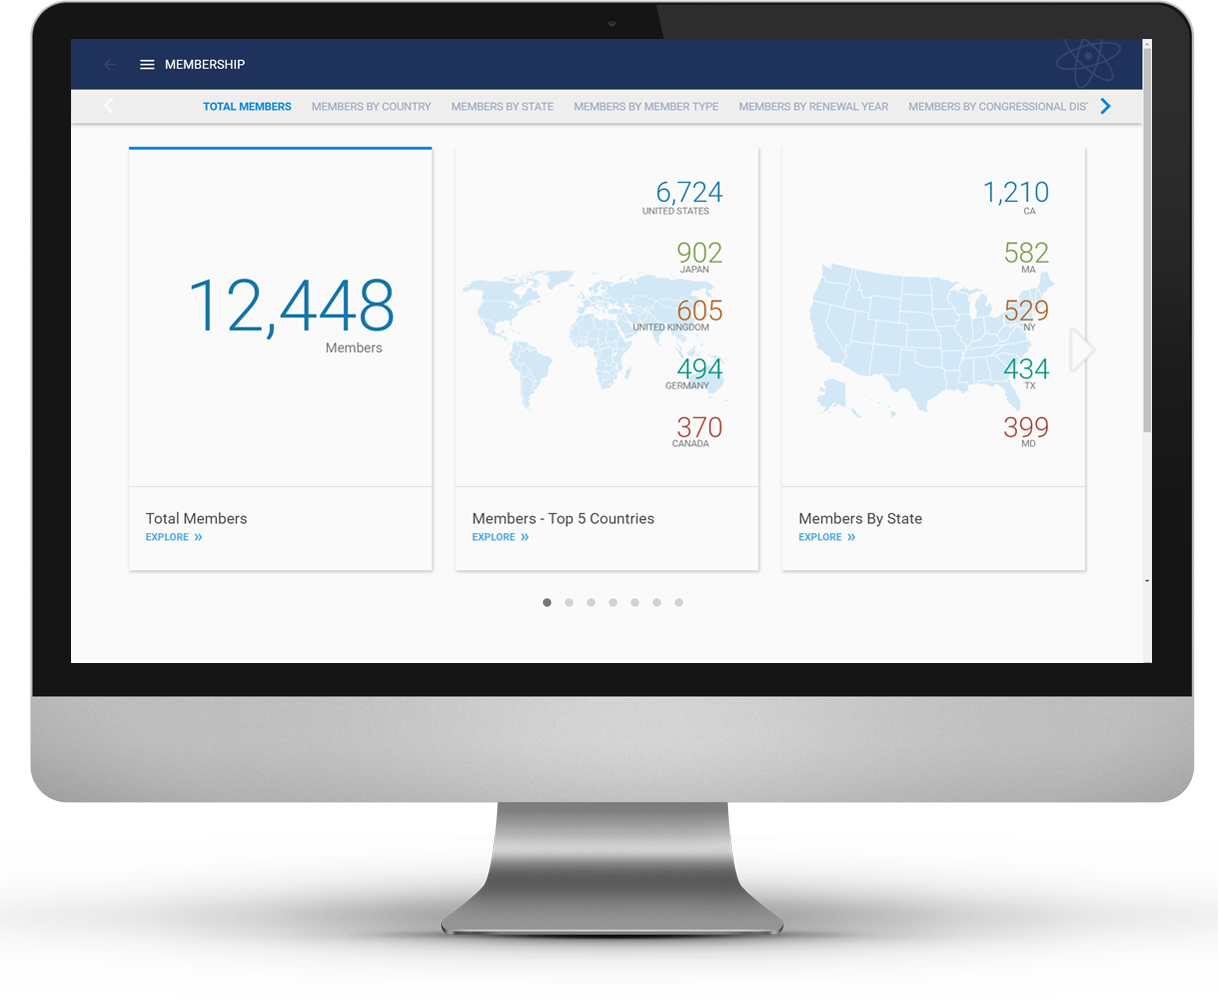
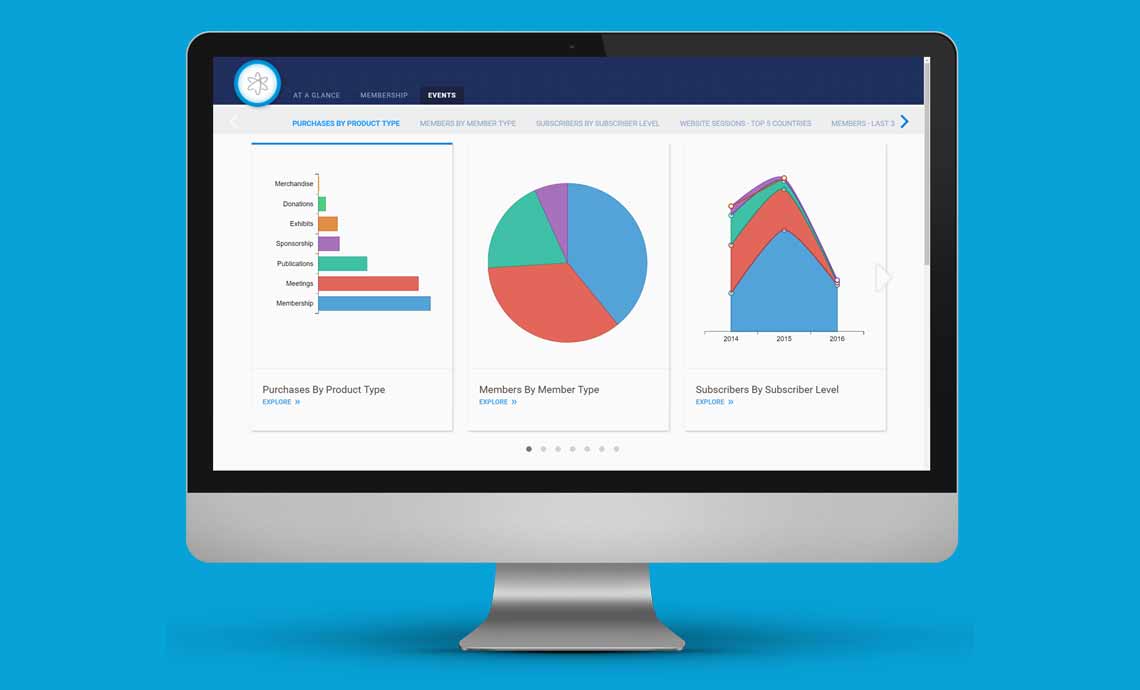
Tools like Google Analytics (GA), which launched in 2005, were some of the first to offer mainstream access to analytics. The benefit of a niche analytics tool like GA is that website owners get rich insights about their website traffic. The reports and dashboards within GA provide insights to questions that some website owners didn’t even think to ask, but certainly can understand.
Looking at the trends chart above, you can see a steady growth of search interest for analytics since 2005. Niche tools like GA have given businesses a thirst for analytics applications specific to their industry. The specific demand within the association industry is what lead Gravitate Solutions to create Nucleus, a data blending and analytics platform. Much like Google Analytics, Nucleus provides easy to understand analytics that matter for associations – both descriptive and predictive.